By Jackson Archer; Dan Hennessey; Madeleine Hirsch; Alexandra Goff
This paper was awarded the 2019 TexITE Technical Paper Award.
Abstract
The transit desert concept serves as an important launching point for the conversation on equity and access in transportation, but it lacks a mechanism to directly address those issues. A transit desert is an area where transit demand exceeds transit supply, identified by census data and an inventory of local infrastructure. The concept, first coined by Dr. Junfeng Jiao, does well to identify where gaps in transit service are most impactful – but attempting to fill the gaps is not an easy process. Transit stops and routes are difficult to relocate in the short-term, often requiring months of planning and a system overhaul before a change can be made. However, with the emergence and popularity of dockless vehicles, there may be a flexible solution to address the gaps in transportation access identified by the transit desert concept.
This paper takes as a foundation the transit gap methodology first introduced by Todd Steiss (Steiss, 2006) and expanded by Junfeng Jiao (Jiao, 2017), and tweaks it to better fit the userbase of dockless scooters and bicycles. Because this process is based on publicly available data, dockless providers can mimic the process to place their vehicles where they are most needed anywhere in the United States.
This paper examines the deployment strategies of the major dockless providers in Austin through the lens of equity. With cities only beginning to plan for this new vehicle type, there is still room to learn from existing efforts while using public data to develop new methods.
1. Introduction
Dockless scooters were first deployed in Austin in April 2018 and were immediately popular, with 67,647 trips in the first full month after deployment.[1] One year later, Austin counted 513,060 dockless scooter trips in April 2019. Austin’s high student population, busy entertainment district, prevalence of bike lanes in the center of the city, and dense urban core made it an ideal candidate for the new type of transportation. The types of trips taken have typically been consistent with the area of deployment – scooters in the University of Texas campus area are used to get between home and class and between classes while on campus, scooters in the entertainment districts shuttle people between bars and restaurants, and those in business districts allow professionals to move between offices or provide a quick way to grab lunch. Regardless of trip type, one thing is consistent: trips are often short. Average trip distance since initial deployment averages just over one mile, with about 13 minutes spent in transit on average. With such short distances covered on average, the introduction of dockless scooters represents an opportunity to reduce the number of short trips taken in a passenger vehicle, resulting in reduced traffic congestion and environmental impact.
Before dockless vehicles arrived in Austin, there only existed a docked bicycle system, known as B-Cycle, which was subsidized by the City. While the docked system still exists in Austin, ridership has sharply declined since dockless vehicles became an option. Between October 2017 and 2018, the service saw a 55% decline in usage (Cobler, 2018). This presumed shift to dockless is likely due to the difference in ease of use – dockless vehicles are more flexible in nature and do not need to be returned to specified locations. B-Cycle also has a more complicated pricing system, with multiple membership options that differ in length and overall hourly cost. The dockless vehicles in Austin are priced at a per-minute rate, and access is linked to the user’s credit card and smartphone. Unlike docked bikeshare, dockless vehicles do not rely on an outside funding mechanism to be implemented. Docked bikeshare requires a commitment to fixed stations which may take the place of street parking. The investment in bikeshare stations may cost anywhere between $30,000 and $50,000 per station (Shaheen et al, 2014).
Docked systems, however, have one large advantage over dockless that stems from the City subsidization. Because many docked systems receive federal funding, the City must comply with Title VI of the Civil Rights Act in their allocation, which prohibits government discrimination based on race, color, and national origin. Docked bikeshare must therefore have some presence in underserved areas of any city that receives federal financial assistance. In Austin, the docked B-Cycle system received an initial $1.5 million of funding from the Capital Area Metropolitan Planning Organization (CAMPO), which was derived from federal grant programs such as the Transportation Alternatives Program (TAP) and Congestion Mitigation Air Quality (CMAQ) program (Adair, 2017). Dockless vehicles are managed by private companies, and therefore there is no similar requirement.
As such, current dockless deployment practices in Austin are based on existing demand. Providers will primarily place dockless vehicles in areas of high-demand, potentially missing areas of latent demand in the city. However, previous transit desert research may help identify where alternative transportation options are most needed. Previous studies have used census data to identify the locations where there is significant transit demand, using a formula that identifies which census block groups have fewer personal vehicles than able drivers. The value of this research was the simple and replicable identification of gaps in transportation access, which could then aid cities in locating new public transportation systems. However, that research did not take into account the process of locating new transit routes, bus stops, and docked bikeshare systems. In the amount of time it takes to create, plan for, and deploy new public transportation options, demographics can change and new gaps in transit access may crop up, especially in fast-growing cities like Austin.
Therefore, the flexibility of deployment of dockless scooters to meet this latent demand can be the natural extension of previous transit desert research. Dockless companies that deploy some portion of their vehicles based on identified gaps in transit access can provide underserved areas with new ways to access employment, grocery stores, or anywhere else as a last-mile solution. This type of trip may differ from many of those currently taken in Austin – deployment to underserved areas creates the potential to connect users to transit stops, or even as the sole mode of transportation between origin and destination for longer trips.
a. Objective
The methods described in this paper can be replicated by dockless providers or governmental entities to temporarily allocate dockless vehicles and to get a sense of community transportation needs. Past research (Steiss, 2006; Jiao and Dillivan, 2013; Jiao, 2017) did not have the benefit of a portable form of transportation to address gaps in access. It is the goal of this paper to provide a roadmap to filling those gaps that does not rely on the lengthy process of creating and deploying transit routes and stops.
b. Research methods
The City of Austin served as the focal point for this analysis. Gaps in access were identified throughout the city limits based on block group boundaries defined by the Census. Demand data was derived from the 2017 American Community Survey 5-year estimates where possible, but 2010 census data was used to identify the proportion of residents living in group quarters who are non-institutionalized. Supply data was also publicly available and derived from municipal agencies and OpenStreetMap (OSM).
The process involved deriving demand for dockless vehicles using a modified version of a formula first created by the U.S. Department of Transportation (Steiss, 2006). The formula was introduced in this research to calculate a transit-dependent population of a given census block group. The formula was later modified to include those who commute via carpool (Jiao, 2017).
Given that previous research was based on a population who depends on transit as the primary transportation mode, the formula needed to be tweaked to focus on potential dockless users. There are a few factors that make the transit-dependent population different from those able to use dockless vehicles. The formula to derive a transit-dependent population allowed for users as young as 12 years old; this component needed to be modified because many scooter companies require users to be a minimum of 18 years old. A second difference is that transit can accommodate those with disabilities. Because dockless vehicles require ambulatory ability and sight at minimum, those with disabilities were removed from this paper’s formula. The full formula is listed below:
Household dockless users = (population age 18 and over) – (persons living in group quarters)
Household dockless users without vehicle access = (household dockless users) – (vehicles available) * car-pooling ratio
Dockless user population = (household dockless users without vehicle access) – (disabled population) + (non-institutionalized population living in group quarters)
This formula included many of the processes that went into the formula to determine a transit-dependent population (Jiao, 2017). Data that was only available at the census tract level was estimated at the block group level using the proportion of the population that existed in each block group. If a block group was found to have a dockless user population of less than zero, that number was rounded up to zero. A Z-score was calculated for each block group in order to compare against the supply data.
Like the demand formula, the elements that went into the supply data calculation for each block group followed a previously established formula (Jiao, 2017). Seven criteria were chosen to establish transit supply in previous research. This paper removed the supply data that was strictly related to transit service, leaving the following four criteria:
- Total length of sidewalks (miles) in each block group
- Total length of bike routes (miles) in each block group
- Total length of low speed limit roads (miles) in each block group
- Intersection density in each block group
Dockless users need proper infrastructure to feel safe in urban environments. Users are unlikely to use the service if the only available surface is high-speed roads with no sidewalks or bike lanes. For that reason, it was important to include elements like bike routes, sidewalks, and low speed roads where dockless vehicles can be safely used. Like the demand formula calculation, Z-scores were assigned to each point of supply data and averaged. Gaps were identified as block groups with higher demand than supply.
The procedure to identify gaps in transportation access can help transit companies locate services, but this process rarely has a quick turnaround. Alternatively, dockless vehicles give municipalities and dockless providers the flexibility to quickly reallocate if the result of deployment does not match expectations. Dockless vehicles therefore afford planners with a great potential to help fill transportation gaps wherever applicable.
Dockless vehicle allocation is currently managed by a combination of the dockless company and the municipality. Municipalities provide the guidelines by which the dockless companies can deploy their vehicles, and the companies create allocation plans and deployment maps that are approved by the city. In the case of Austin, dockless companies are required to create zones of at least five square miles in size within which they can deploy a maximum of 250 dockless vehicles. One zone is common among all companies and mandated by the City: the Downtown Austin Project Coordination Zone (DAPCZ). This zone spans roughly the entire downtown core at a size of just over nine square miles. Dockless companies are permitted to allocate 500 vehicles to this zone, and 250 vehicles to all other zones of their design. For this paper, the allocation practices of the four main dockless scooter companies in Austin – Bird, Lime, JUMP, and Lyft – will be examined.
2. Results
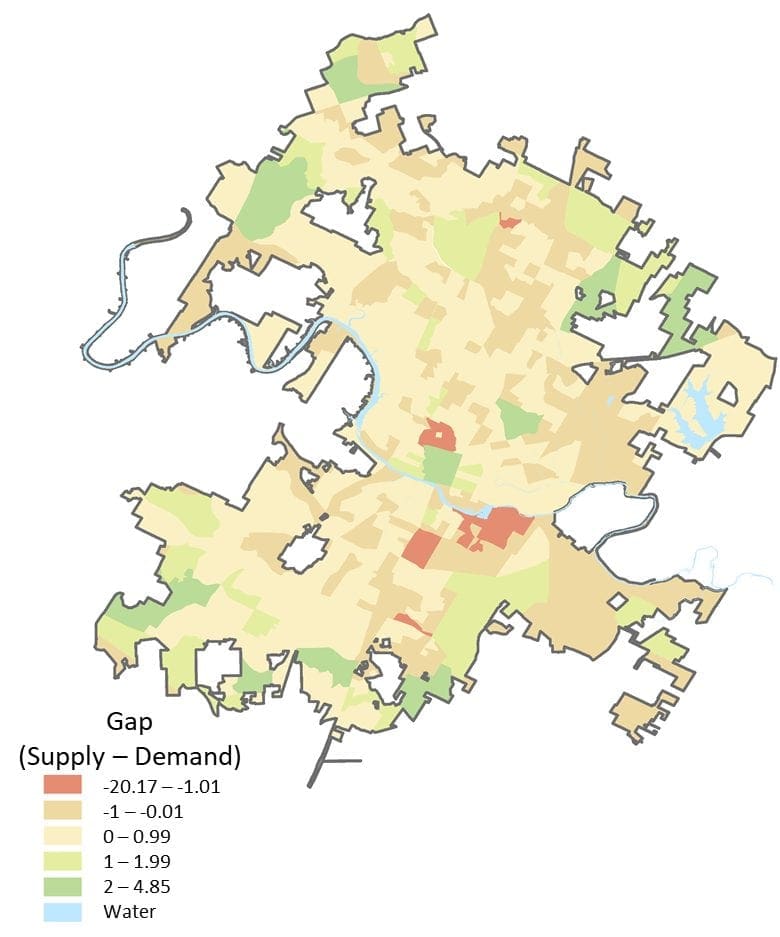
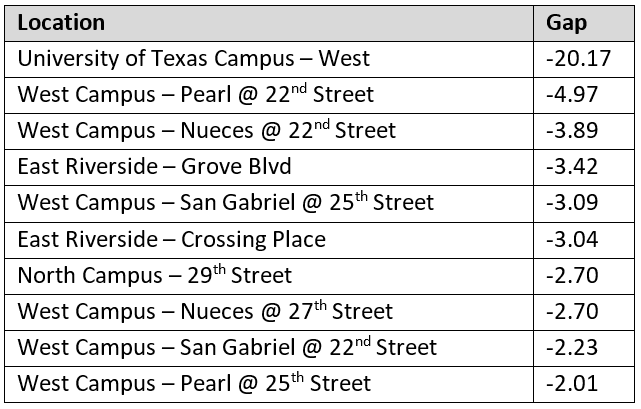
The access gap map for Austin (Figure 1) shows the results of the process described in the previous section. The areas in red are those that have a significant gap in access and a need for non-car transportation options, defined as having a high number of potential dockless users and adequate transportation supply – bike lanes, sidewalks, low-speed roads – to accommodate potential users. Table 1 displays the ten block groups with the largest gaps. The table is dominated by the West Campus area, which makes up six of the ten block groups with the largest access gaps. Two additional campus-area block groups make the top ten, with the largest gap belonging to the block group aligned with the west side of the University of Texas campus itself. There are two non-campus block groups in the table, both in the East Riverside area.
Overall, there are three primary access gap clusters in Austin: University of Texas campus, East Riverside, and St. Edward’s campus. Two additional block groups see a large gap in access: one in south Austin near the intersection of William Cannon Drive and I-35, and one in far north Austin near the intersection of Burnet Road and Mopac Blvd. These two block groups are unique in that they each see a high-density land use – a community college campus in the north, and a large apartment complex in the south – paired with an open space land use component that makes up the bulk of each block group. This creates a combination of average demand and low transportation infrastructure due to much fewer roads per square mile, resulting in a gap that just barely meets the threshold of a -1.01 Z-score.
The University of Texas currently restricts dockless scooter speeds to 8 miles per hour on the western half of its campus.[2] St. Edward’s University prohibits commercial electric scooters and bikes entirely from campus. The St. Edward’s campus itself makes up about one third of the St. Edward’s Campus cluster, seen in Figure 2.
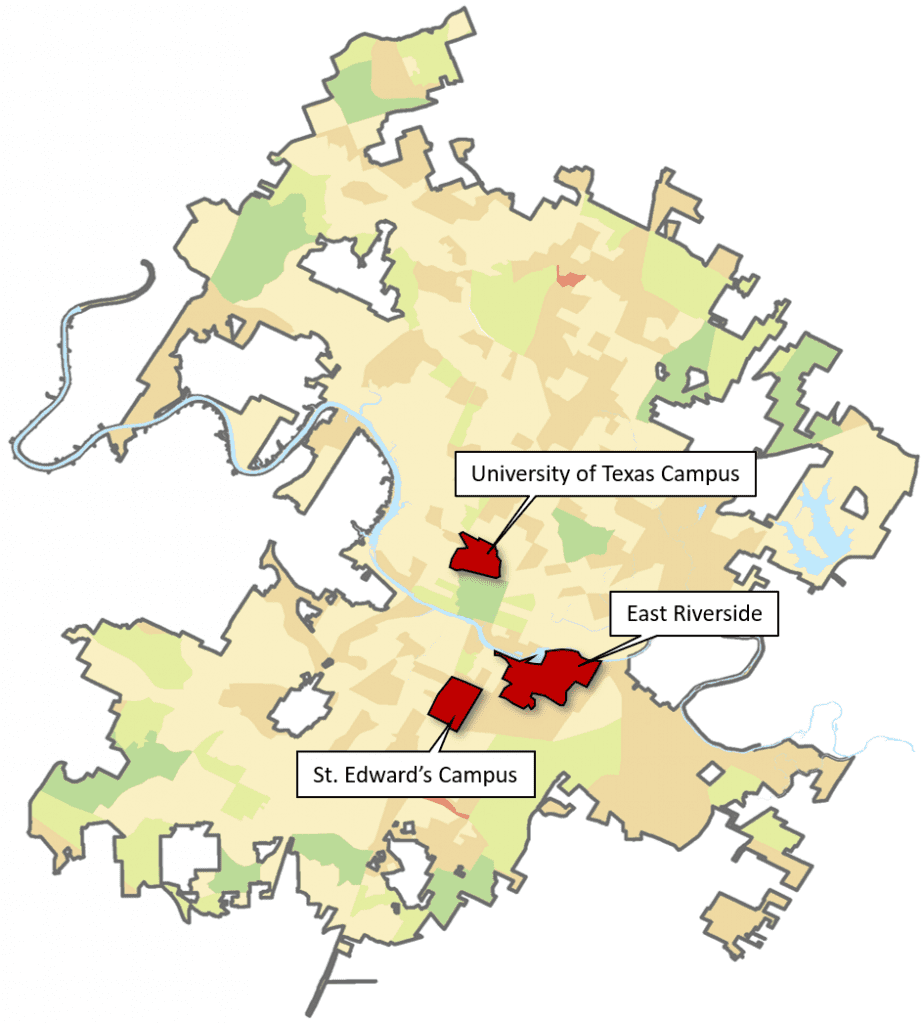
The three main access gap clusters are shown in Figure 2. The University of Texas campus cluster sees a high demand for non-car transportation and a high supply of infrastructure that would support it – namely, bike lanes, sidewalks, low speed roads, and a density of intersections. This area already has decent transit coverage, so dockless vehicles in this area would be most helpful to complete the first or last mile of a journey or as an alternative to transit for an area with a high student population. According to data provided by the City of Austin, scooter trips average a distance of roughly one mile. The University of Texas campus itself is near enough to these campus-area block groups for scooter trips to be made directly from home to campus.
The second cluster of block groups with a large access gap is in the East Riverside area in the southeast urban core. This is another area with a high student population, but it differs from the north campus area due to its historically high low-income population. Residents in this area may use dockless scooters differently from those in the campus area; students in the area would likely not use a scooter as their sole transportation method to access the university due to the distance between East Riverside and the University of Texas campus (roughly four miles). Scooters in this area could instead serve as a last-mile solution for students who rely on transit and as a commuting method for other residents. Lake Austin, just north of the Riverside area, serves as a natural barrier to Central and East Austin; the result is longer trips originating from East Riverside that are unlikely to be made solely via scooter.
The third cluster is found near the St. Edward’s University in south Austin. Like the north campus cluster, this area features a high number of students, but overall demographics for the area tend to be more similar to the East Riverside cluster (explained more in the next section).
3. Origin-Destination and Demographic Data
The City of Austin provides a free database[3] detailing all scooter activity that takes place in the City. This includes trip duration, trip length, start and end time, date, and the origin and destination census tracts. With this data, the origin and destination of scooter trips can be compared against the results of the access gap methodology to identify if dockless trips happen where census data has identified a need for transportation access. In some cases, the answer is yes – the University of Texas campus area sees a high number of daily trips in comparison to the surrounding census tracts. However, there are census tracts that see a high number of trips but are not designated as locations where access gaps exist, such as Austin’s downtown core and the South Congress area. The reason for this is simple: the access gap methodology provides information on where scooters could be deployed based on need – a lack of personal vehicle access. The downtown core and South Congress areas are locations with a high retail and restaurant presence, so scooter trips in these areas are likely replacing walk trips rather than personal vehicle trips.
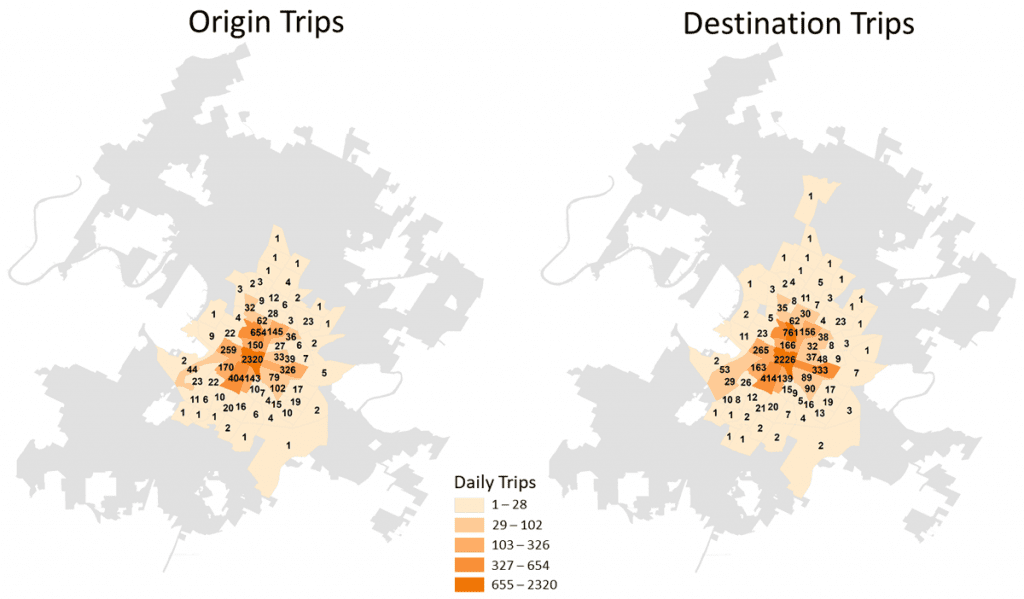
Figure 3 shows the number of dockless scooter trips originating and terminating in census tracts across Austin. The pattern of dockless trips are very similar between origin and destination maps, indicating that typical trips are short and often remain within the same census tract. In the month of April, dockless scooter trips averaged a distance of 0.98 miles per trip across 513,060 trips in Austin.[4]
The demographics of access gap clusters fit into two different buckets: the East Riverside and St. Edward’s Campus clusters have a mix of student and non-student populations, while the University of Texas Campus cluster sees primarily a student population. The St. Edward’s Campus cluster does have one block group with a low average age and median household income, but a high non-student population in adjacent block groups brings up the average age and median household income to make it more similar to the East Riverside cluster.
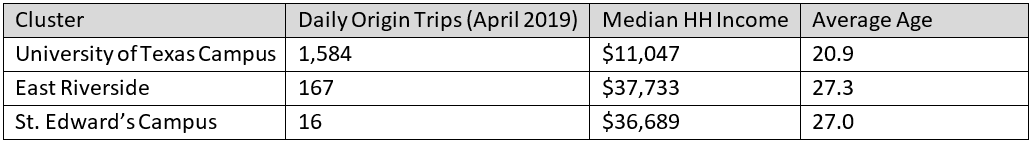
Many students do not have access to personal vehicles and typically report as being low-income (though their actual income level likely does not reflect their means), which partially identifies the reason there are large gaps in transportation access in areas with a high student population. Dockless scooter deployment to the University of Texas Campus and St. Edward’s Campus clusters would likely see vehicle trips between the university and student housing. Overall, these areas are well-represented by dockless provider deployment strategy, in that both clusters are located within the zone boundaries defined by dockless providers. However, the number of originating trips differs greatly between each cluster. The University of Texas Campus cluster in particular sees a high number of dockless scooter trips originating in the associated census tracts, especially in comparison to the East Riverside and St. Edward’s Campus clusters. The disparity in trips could be due to a number of factors, but vehicle deployment and availability likely plays a large role.
The East Riverside cluster is a historically low-income area of Austin. While this area is slowly gentrifying with new tech offices, bars, and restaurants, there is still a significant non-student low-income population. The block groups in the East Riverside cluster with an average age higher than 25 see a median household income of $40,841, far less than the median household income of Austin as a whole.[5] Located adjacent to the body of water that bisects the city, connectivity is an issue in the East Riverside cluster in comparison to the student-heavy clusters. All three clusters are represented by the zones defined by the four major dockless providers (see Figure 4, next section).
4. Current Deployment Efforts
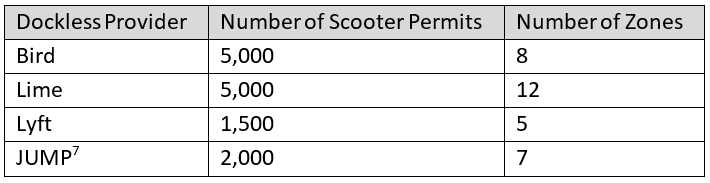
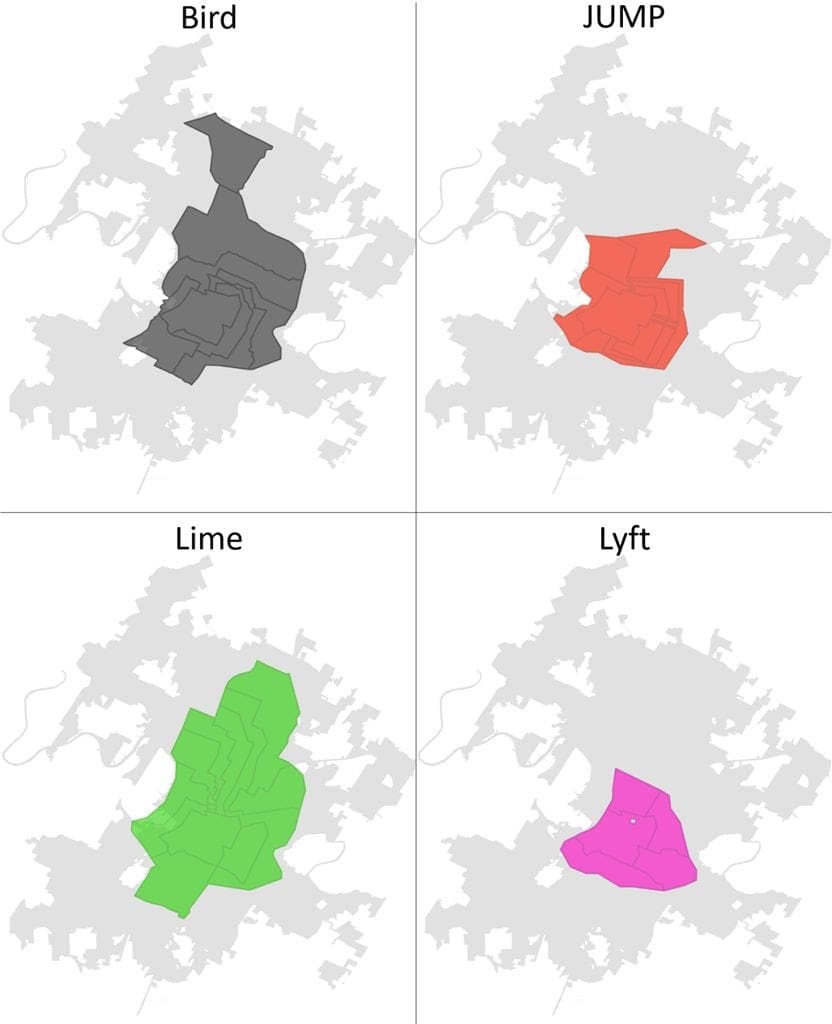
Based on Figure 4, it would seem that dockless scooters are not uniformly deployed throughout each zone. Indeed, as demand can be heavy within one section of a zone and light in other sections of the same zone, such a strategy wouldn’t be viable. Dockless providers have indicated that scooter allocation is based on high-demand areas. The shape of each zone would back this up.
In defining zone boundaries, Lime, Bird, and JUMP each employ a strategy similar to political gerrymandering. This method involves shaping deployment zones so that areas of high demand can be split across two or more deployment zones. This way, rather than fitting a high-demand area into just one zone, dockless providers can allocate more dockless vehicles to these areas than would be permitted in just one zone. For example, JUMP has shaped its zones so that the University of Texas campus area is covered by six separate zones. In theory, this would mean that JUMP could deploy up to 1,500 dockless scooters in this area alone. JUMP’s zones are also designed to maximize deployment in East Central Austin, where boundaries are split along corridor lines. Using this method, dockless providers can deploy more scooters to smaller areas than would normally be allowed per City rules, which permits only 250 dockless scooters per 5-square-mile zone. Focusing deployment on select areas, such as the University of Texas and Central East Austin, means that residents in areas such as the St. Edward’s University campus and East Riverside that have high access gaps do not have adequate access to dockless transportation despite being located within deployment zones.
5. Equity Discussion
Previous research has shown that docked bicycle stations have historically been placed in areas of higher socioeconomic prosperity (Smith et al, 2015). However, the four primary dockless providers in Austin do not seem to have placed their deployment zones specifically along socioeconomic lines. The differing approaches in zone creation by the four dockless providers makes it difficult to assign any overall equitable strategy to Austin’s dockless system, but all companies have one thing in common – deployment is focused on the central Austin core, which consists of a mix of high- and middle-income populations. This is due to the existence of a prominent university near the downtown district; downtown Austinites reside in block groups adjacent to university students, which means that high and low median household incomes alike are captured within the deployment zones of all major scooter companies in Austin.
Zone placement is as equitably inclusive as it is equitably exclusive – the Far West Austin and Far East Austin areas, Austin’s wealthiest and poorest areas, respectively, are both excluded from Austin’s dockless deployment zones. This is likely due to practicality – both areas, despite having very different demographics, have relatively low intersection density and lack infrastructure such as sidewalks and bike lanes. Each area likely lacks infrastructure for different reasons – wealthy and influential residents of Far West Austin wanted to keep people out, while the lack of infrastructure in Far East Austin can be attributed to a lack of investment – likely a symptom of the racial animosity coded into the City’s early plans and policies. Additionally, there are few non-residential destinations in these areas. Deployment zones in Austin overall see lower median household income and a higher percent of population below the poverty line than Austin as a whole. This is likely due to the high student population within deployment zones and the exclusion of Far West Austin.
Still, previous research has shown that residents in underserved neighborhoods use dockless vehicles differently. A pilot conducted in Portland, Oregon required operators to deploy 20% of their fleets to areas designated as underserved areas – in this case, East Portland. Average trip distance in Central Portland was similar to what is seen in Austin: about one mile per trip. In East Portland, however, trip distances averaged 1.6 miles per trip. There was also a noted difference in peak traffic. In Central Portland, dockless usage was consistent with typical weekday afternoon peak periods, indicating that those residents used dockless vehicles immediately after leaving their jobs. While there was an uptick in usage during the afternoon peak period in East Portland, there was less of a clear afternoon peak period than in Central Portland (PBOT, 2019).
A common access barrier for dockless vehicle usage is the smartphone- and credit-card-based nature of the service. In Austin, there is no requirement for dockless vehicles to have an option for cash-based usage. This differs from Washington D.C., for example, which requires dockless providers to have an option for cash-based and non-smartphone access in order to be permitted. Similarly, in PBOT’s dockless pilot, there was a requirement to support these options. Aside from a lack of equitable deployment, this is viewed as the largest access barrier for the low- and middle-income population in Austin.
Each of the major dockless providers has a low-income option, which is based on discounted rides. The bulk of these programs rely on the elimination or reduction of the unlock fee (usually $1.00 per ride), but some programs involve monthly memberships and a capped number of ride hours per month. Not all programs are available in Austin. Providers are aware of the barrier to access that exists in a smartphone-based system, and some have taken measures to reduce the barrier. Lime and Bird currently have programs to allow for access without a smartphone in select cities, while Lyft and JUMP have no such program.
6. Conclusion and Recommendations
In conclusion, the deployment zones of Austin’s four primary dockless providers cover the areas with highest gaps in transportation access with high demand, but allocation strategy likely means that those areas do not see adequate deployment. In the case of Austin, underserved areas likely lack the infrastructure supply – sidewalks, bike lanes, and intersection density – for dockless vehicles to be feasible. Additionally, dockless providers’ allocation strategy does not deploy uniformly throughout zones. This means that zones that contain more low-income neighborhoods adjacent to high-demand areas may not see equal deployment in all neighborhoods, which results in the exclusion of the low-income neighborhoods. In essence, dockless providers in Austin are focusing their efforts on deploying scooters to two areas: the University of Texas Campus and the Central East Austin, and their zone design seems to support that.
The City of Austin’s mandated downtown zone does well to ensure access throughout the primary business district – an area which, according to the access gap map in Figure 1, does not necessarily need additional dockless options from an equity perspective. If that equity of access is desired in other locations, a similar system needs to be created to define zone boundaries for other high demand areas in Austin such as the University of Texas campus and Central East Austin. Mandating the number of scooters deployed to these areas would have a twofold effect: scooter congestion would be less of an issue in the area, which is seemingly more in line with the City’s initial desire with respect to the creation of the permitting rules, and it would allow dockless providers to explore other corners of their deployment zones to potentially unearth new areas of demand.
Since allocation is currently based on demand, latent demand may be missed in areas like East Riverside, where daily dockless scooter trips are far lower than areas that see less of an access gap to alternative transportation. Indeed, there can be many explanations for the lack of dockless adoption in areas that do not currently see high demand, including adequate transit coverage, lack of non-cash-based access, and connectivity issues, among others. All zones are not equal: different demographics use dockless vehicles in different ways, and it is not feasible to treat an entire population in the same way in terms of vehicle allocation. However, there are certain barriers to access that can be easily fixed. Mandated cash- and non-smartphone-based access options for all dockless vehicles in the city would further increase the equity of this transportation option, following the example that Washington D.C. set in their dockless permitting process.
Footnotes
- While scooters were first deployed in April 2018, they were pulled from Austin streets between April 29th and May 23rd 2018 while the City developed a regulatory and permitting framework. Data is from June 2018.
- Dockless scooter speeds in the City of Austin are limited to 15mph.
- https://data.austintexas.gov/Transportation-and-Mobility/Dockless-Vehicle-Trips/7d8e-dm7r/data
- http://transportation.austintexas.io/dockless-data/
- $73,581 according to the 2017 American Community Survey 5-year estimates.
- As of April 24, 2019
- Note that JUMP deploys dockless bicycles in addition to dockless scooters, which limits the maximum number of scooters per zone. The City of Austin requires a maximum of 250 dockless vehicles per zone (and 500 for the DAPCZ), which JUMP splits between bicycles and scooters.
- As of April 24, 2019
References
- Adair, M. 2017. Austin B-Cycle: About Austin’s bike share system. https://issuu.com/arch_type/docs/austin-bikeshare_adair
- Cobler, P. 2018. Austin’s B-cycle was riding high. Then scooters came to town. Austin American-Statesman. https://www.statesman.com/news/20181120/austins-b-cycle-was-riding-high-then-scooters-came-to-town
- Jiao, J. 2017. Identifying Transit Deserts in Major Texas Cities where the Supplies Missed the Demands. Journal of Transport and Land Use, Volume 10, No. 1, 529-540.
- Jiao, J., & Dillivan, M. 2013. Transit Deserts: The Gap between Demand and Supply. Journal of Public Transportation, Volume 16, Issue 3.
- Portland Bureau of Transportation (PBOT). 2018. 2018 E-Scooter Findings Report. https://www.portlandoregon.gov/transportation/article/709719
- Shaheen, S., Martin, E., Cohen, A., Chan, N., Pogodzinski, M. 2014. Public Bikesharing in North America During a Period of Rapid Expansion: Understanding Business Models, Industry Trends & User Impacts, MTI Report 12-29.
- Smith, C., Oh, J-S., Lei, C. 2015. Exploring the Equity Dimensions of US Bicycle Sharing Systems. Transportation Research Center for Livable Communities at Western Michigan University, Report No: TRCLC-14-01.
- Steiss, T. 2006. Calculating/analyzing transit dependent populations using 2000 census data and GIS. Census Transport Planning Package Status Report.