Download this publication as a PDF
The Challenge
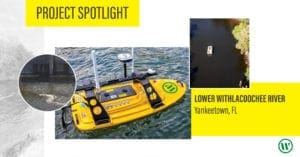
The Florida Department of Transportation (FDOT) District Three undertook the replacement of two bridges: The John T. Brooks Bridge located in Walton County (US 98) and the Theo Baars Bridge in Escambia County (SR 292). The original bridges were two-lane and would be replaced with multi-lane divided highway sections. Both the Brooks and Theo Baars bridges are similar in length (around 2,100 ft), and both cross the Florida Gulf Intercoastal Waterway. Theo Baars Bridge was completed in February 2023, and the Brooks Bridge is scheduled for completion in fall 2027.
Accurate 3D mapping of existing utilities is essential to most road and bridge projects. Accidentally driving a pile through an electric, gas, or telecommunications pipeline — due to a contractor’s reliance on erroneous utility data — could be disastrous. FDOT’s goal is to prevent damage during construction to existing subaqueous pipelines presumed to be near proposed pier foundations.
Utility owners provided WGI with limited as-built information on existing subaqueous conduits. However, this information was deemed to be of no higher certainty than ASCE 38 Quality Level D (i.e., QLD is the lowest level of positional certainty).
Located in the West Florida cities of Fort Walton Beach and Pensacola, these case studies were ideal opportunities to showcase WGI’s alternate surveying methods that can be deployed to accurately map subaqueous utilities when traditional geophysical prospecting and Global Positioning Systems (GPS) are not practical, or even possible. Note that GPS signals are not receivable underwater.
FDOT’s task order to WGI is simply summarized below:
“How can we accurately locate these two utility crossings? Both are twenty to thirty feet below the bottom. The water is fairly swift when the tide is moving. We would need horizontal (position) to be plus or minus two feet most likely as fender system piles would have to be driven on either side of the facilities. I need a high-level proposal to start with, including the accuracy level(s).”
WGI narrowed down its surveying options to a technology that is wellsuited to this challenge – inertial navigation.
The Science Behind Inertial Navigation
Inertial navigation is the same technology that submarines use to track their positions. An Inertial Navigation System (INS) is also one of the backup navigation systems used by military and commercial aircraft. If GPS instruments malfunction or there is a temporary loss of satellite signal reception, the INS takes over to provide the flight crew with accurate positioning.
Based on inertial principles, acceleration and angular velocity of an object are measured by inertial sensors consisting of accelerometers, inclinometers, and gyroscopes. Accelerometers measure sensed force caused by an object’s acceleration relative to inertial space. The gyroscopes measure sensed angular velocity relative to inertial space. Miniaturized accelerometers and gyroscopes are also found in today’s smartphones.
Equations integrating the gyro and accelerometer measurements into velocity, position, and attitude are called the Navigation Equations. Attitude is also known by three components: pitch, roll, and yaw.
Survey observations are made with traditional survey instruments (i.e., Total Station, GPS, Differential Leveling) at both ends of a pipeline or empty pipe to establish starting geodetic reference X, Y, Z coordinates. The inertial reference device (probe) then travels through the pipe to either the end point, or to its tethering limit, then is retrieved (pulled back). The probe’s path is recorded several times. The probe produces X, Y, Z data that plots its location as it travels through the pipe.
The Process
- De-watering and excavation of endpoint trenches, as needed.
- Survey starting and ending coordinates and elevations of the pipeline crossings using Real Time Kinematic (RTK) GPS, Total Station, and differential leveling.
- Deploy the Accurate Mapping Probe (AMP™) tool to measure the internal horizontal coordinates of the pipeline and its vertical elevations. The AMPTM inertial tool collects horizontal coordinates and vertical elevation measurements at the rate of 100 readings per second using onboard gyroscopes, accelerometers, and inclinometers.
- Map the pipeline’s subaqueous conduits by successive pull-through observations. The WGI Geospatial team reviews the position measurement data for repeatability and its observed spread (distance from the mean path).
- Pipeline X, Y, and Z data are plotted and reviewed for quality control. Additional pull-throughs of the AMP™ and supplemental surveying may be ordered and performed at this time.
- Final digital electronic delivery of utility plan-profile sheets to FDOT.
Precision and Accuracy
The WGI Geospatial team reviewed the repeatability and precision of the positional data measurements and the observed spread (i.e., the distance from the mean path to individual measurements, also known as residuals in statistical terms). Certain random errors can affect the results of mapping:
- Alignment, noise within the system, velocity of probe, and consistency.
- The pipeline’s configuration such as number of fittings, offset joints, and pipe ovality
Positional data are reviewed to confirm consistency and repeatability. The data go through a series of on-site diagnostic tests where the following parameters are field verified for each 3D measurement using the AMP™ software:
- Scaling Factor – distance traveled scales properly to provide starting and ending coordinates/elevations
- Odometry – confirmation of wheelset properly tracking
- Velocity – confirmation that the tool was advanced at a specified velocity and that spikes in velocity saturated the sensors
- Roll – graphical depiction of the amount of roll (around its own axis) experienced by the tool while advanced through the pipeline
- Pitch – graphical depiction of the amount of pitch (up and down) experienced by the tool while advanced through the pipeline
- Yaw – graphical depiction of the degree of changes in direction (left/right) experienced by the tool while advanced through the pipeline — also known as Azimuth (direction)
- Plan view depiction (X, Y)
- Profile view depiction (Z)
Data are then evaluated further by comparing the measurements to one another (repeatability). The arithmetic mean of the plan and profile alignment of the pipeline are computed based on the measurements being reviewed. Then, the maximum distance between at least two measurements is calculated. This is referred to as the maximum observed spread. The maximum observed spread is then multiplied by 0.5 to determine the distance to the mean position in the pipeline.
For example, for the Okaloosa Gas pipeline at Brooks Bridge, the following was observed:
- Max XY spread = 2.8 ft x 0.5 = 1.40 ft (Left and right of mean path)
- Max Z spread = 0.35 x 0.5 = 0.175 ft (Up and down of mean path)
These values are further reduced when considering the outside diameter (OD) of the pipeline was 0.71 ft and that the measurement references the centerline of the pipeline.
In the case of the AT&T conduit, the presence of buried junction boxes, vaults, and couplings along the north side of the Brooks Bridge project site and debris (sand) within the pipeline contributed to higher observed spread values than typically experienced. The manufacturer of the AMP™ tool performed an in-depth review of the collected data by reviewing it at the individual sensor level. In some of the measurement runs, large sensor spikes were apparent at the junction box location. Based on this review, a tentative mean path was derived.
The AMP™ tool’s manufacturer identified the junction box location where the mapping software experienced sensor spikes. Additional RTK GPS positions were observed at the junction box since this was the area that experienced the highest observed spread. The additional RTK GPS points resulted in a reduction of some of the observed spread. WGI was able to vacuum excavate, expose, and collect data at three survey locations (the junction box and one on each side of the junction box). WGI furnished this additional survey data to the manufacturer. The three additional survey locations lined up directly with the tentative mean plan and profile of the AT&T conduit.
- Max XY spread = 8.36 ft x 0.5 = 4.18 ft (left and right of average)
- Max Z spread = 1.75 x 0.5 = 0.875 ft (up and down of average)
These spread values were further reduced when considering the OD of the steel carrier pipeline, which could be 0.48 ft to 0.50 ft. Also, since the 1.25-in conduit is within the carrier pipeline along with the other conduits, its exact location within the carrier pipeline identification would not be known.
The mapping tool used for the 1.25-in conduit is a chip gyroscope technology and is slightly less accurate than the optical gyroscope technology used in the tool for the gas main.
The Deliverables
WGI’s deliverables to FDOT consisted of plan-profile sheets of all involved utilities in digital electronic formats.
Final Remarks
Inertial surveying is not without its uncertainties and challenges. WGI geospatial and subsurface utility investigation crews worked alongside Pipeline Inspection Partners Corp of Bridgeville, Pennsylvania, to deliver successful task orders for FDOT.
At the completion of the Theo Baars Bridge project, we asked FDOT’s project manager for feedback on our efforts. Were our utility locates accurate? Were there problems with our survey depictions? His reply was simply: “NO utilities were harmed during construction.” That was music to our ears!