As a mobility company, WGI is helping clients adjust to technology trends shaping not only transportation, but urban design, parking, and broader access to destinations. Among trends, no other technology has grabbed attention quite like shared electric scooters.
Why scooters? Certainly, they are eye catching and fun. There’s also been quite a bit of drama as cities and scooter companies tussle over a balance between regulations and experimentation. This post looks at the past two years of experiments, taking a deeper dive into the topic of equity.
In the United States, scooter share traces its roots to the company Scoot, which launched service in San Francisco in 2012. Within a couple of years, transportation network companies (TNCs) like Uber and Lyft burst onto the scene, and investors began to fund all manner of transportation innovation, such as shared systems for dockless bicycles, e-bicycles, and scooters.
These dockless schemes differed from traditional station-based (or docked) bike-share systems. In docked systems, users are required to rent and return a bicycle at established parking stations. Users find a station using the vendor’s mobile app and check out a bike (if one is available) and return a bike (unless all the docking slots are full). To overcome the frustration of empty or full stations and provide more ubiquitous access, entrepreneurs introduced a new rental scheme in 2016: the dockless bicycle.
While solving the station problem, dockless bikes created others, notably sidewalk clutter and improperly parked bicycles in public rights-of-way. At the same time, other companies began dropping dockless stand-up scooters. While scooters occupy a slightly smaller space, cities still fielded complaints about parking and clutter. In some instances, scooter companies launched service without notifying the local jurisdiction, which set off tension between riders who supported a new travel mode and regulators who manage public rights-of-way.
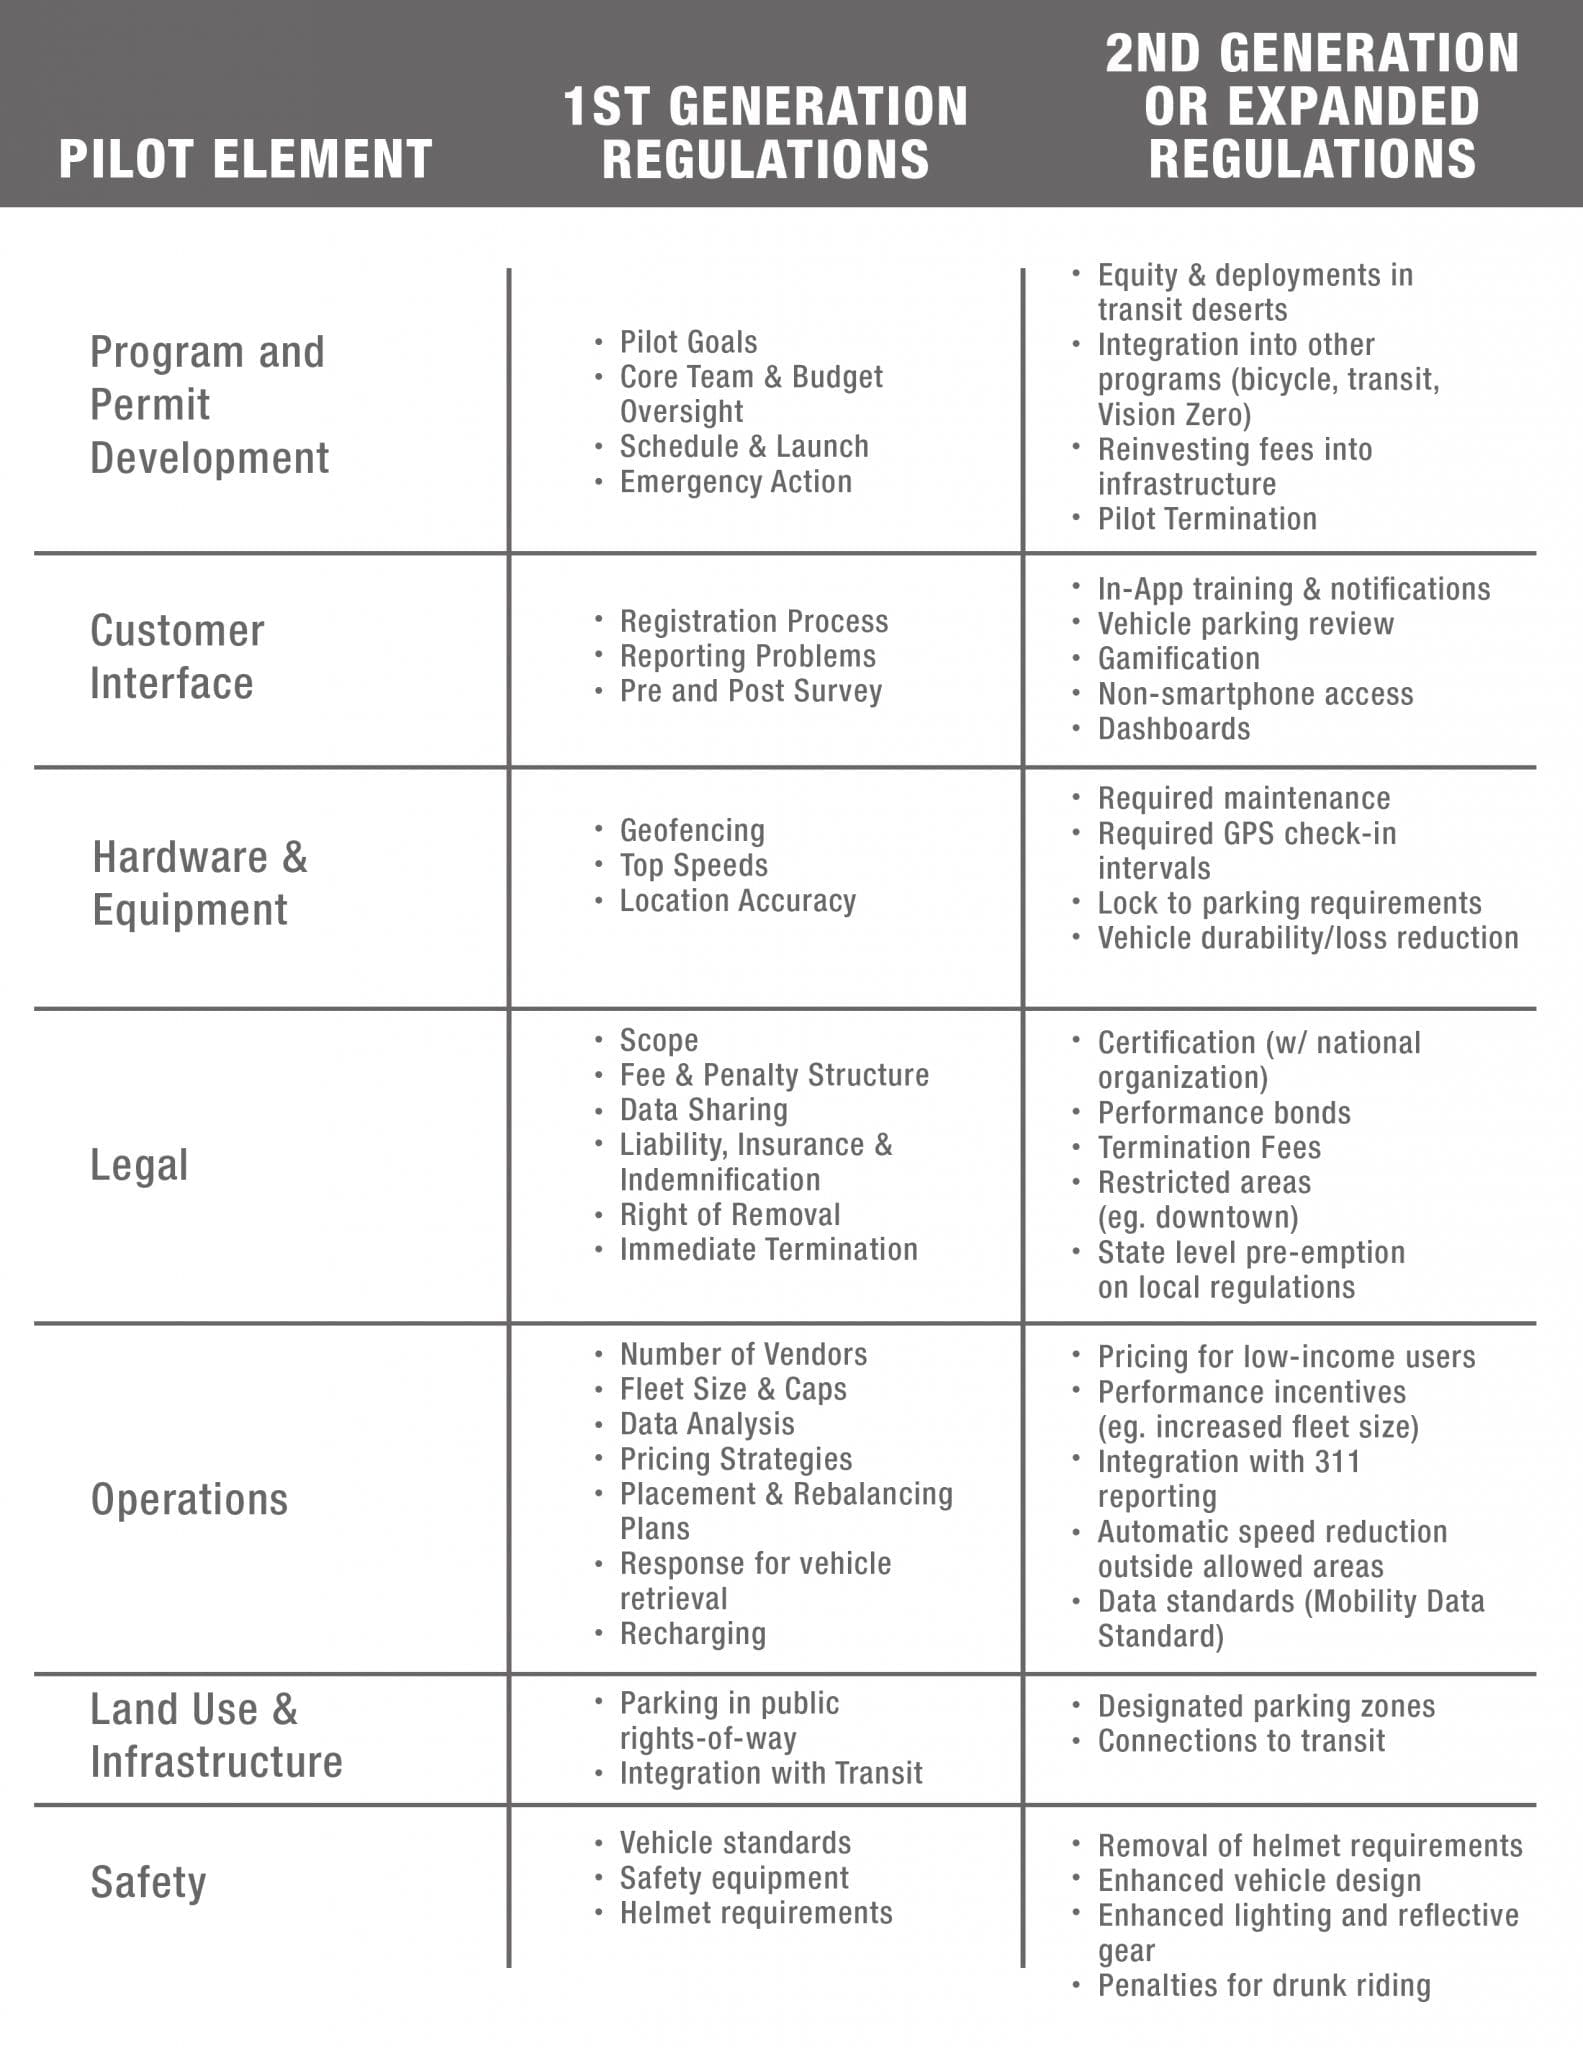
Cities soon found ways to manage dockless mobility through pilot projects and permitting for use of public rights-of-way. Some of the early provisions and expanded regulations in second-generation permits include:
A Deeper Dive: Transit Deserts
Ensuring equitable and widespread access to shared-use mobility is among the top goals of both cities and vehicle providers. Once the early proof of concept deployments revealed demand for mobility options, cities and transit advocates wanted to make sure vehicles would be available in areas of most need. Using data, transportation advocates previously identified “transit deserts,” or areas lacking transit and transportation options; WGI took that a step further to identify areas that would be particularly served by scooters and other dockless vehicles.
Certainly, increasing the deployment of scooters to transit deserts is positive. Through permitting processes, cities found new sources of data to better understand opportunities and enduring challenges with transit service gaps. However, at WGI we noticed that the new data would not be useful unless we improved outdated and narrowly focused analytical methods.
The City of Austin requires providers to supply data on individual trips, including distance, time, origin and destination locations, and type of vehicle, among others. Additionally, Austin’s deployment of dockless scooters ranks among the highest numbers in the world. As a result, the City has a comprehensive, publicly available dataset and serves as a prime candidate for the study.
Our study reformatted the traditional gap analysis to include scooters. To identify gaps, we calculated demand and supply for each census block group. To calculate demand, we looked at demographic data that identified the number of household vehicles and the number of driver-aged residents. In locations with a higher number of driver-aged residents than household vehicles, it was determined that there was inherent demand for non-passenger vehicle transportation with the following formulae:
- Household dockless users = (population age 18 and over) – (persons living in group quarters)
- Household dockless users without vehicle access = (household dockless users) – (vehicles available) * car-pooling ratio
- Dockless user population = (household dockless users without vehicle access) – (disabled population) + (non-institutionalized population living in group quarters)
To calculate supply, we looked at the supply of infrastructure that determines density and areas where dockless scooters can safely be used. This included elements like sidewalk miles, bike-lane miles, low-speed-limit road miles, and intersection density. We calculated Z-scores for supply and demand and compared against each other. Areas with higher demand than supply were identified as gaps.
What We Found
Results show that areas with transportation access gaps were concentrated into three key areas: The University of Texas at Austin (UT) campus, the East Riverside area, and the St. Edward’s Campus area. Demographic analysis shows that these three areas all fall well below the average median household income in Austin (~$75,000).
The UT campus area has a vast student population, with an average age of 21 years old. Students typically have low incomes but have the financial means to make use of premium, app-based services (ridehailing, scooter share).
The East Riverside area is a traditionally low-income area in Austin, but it has seen some demographic shift over the last 10 years. Today, Riverside is mainly made up by a low-income, non-student population, but the main transportation access barrier is geographic; there is a highway to the west and a body of water to the north with few crossing points.
The St. Edward’s campus area is more demographically similar to East Riverside than UT. This is due to a high non-student population: UT is home to roughly 50,000 students, whereas St. Edwards, a private university, sees just under 5,000 students enrolled in any given year. Many working class, low-income people live in this area, which sees an average age of 27 and median household income of about $35,000.
These three areas are in highest need for non-automobile forms of transportation, but they see different levels of dockless scooter allocation. Austin’s permitting guidelines allow dockless providers to choose where scooters will be deployed. The UT campus, being the only area of the three listed previously to have a low-income population, but has access to resources, sees far higher scooter deployment numbers than the other two clusters (East Riverside had 90% fewer scooter trips compared to UT campus in April 2019; St. Edward’s campus had 99% fewer). Despite dockless mobility having great potential to combat non-car transportation access barriers, dockless providers are not yet doing their part in filling the gaps.
What Does This Tell Us About Scooters and Transit Deserts?
Scooters showed the latent demand for options to conduct short trips in high-density settings such as high-value downtown markets and campuses. Outside of these markets with the highest ridership potential, we don’t have a good picture of latent demand in areas outside of high-demand zones. As the graphic shows below, this is a vitally important question since close to 60% of trips are short (less than six miles) and easily addressed by smaller electric and shared vehicles. This raises an important question: how can cities and mobility companies fill these gaps while building sustainable micromobility systems?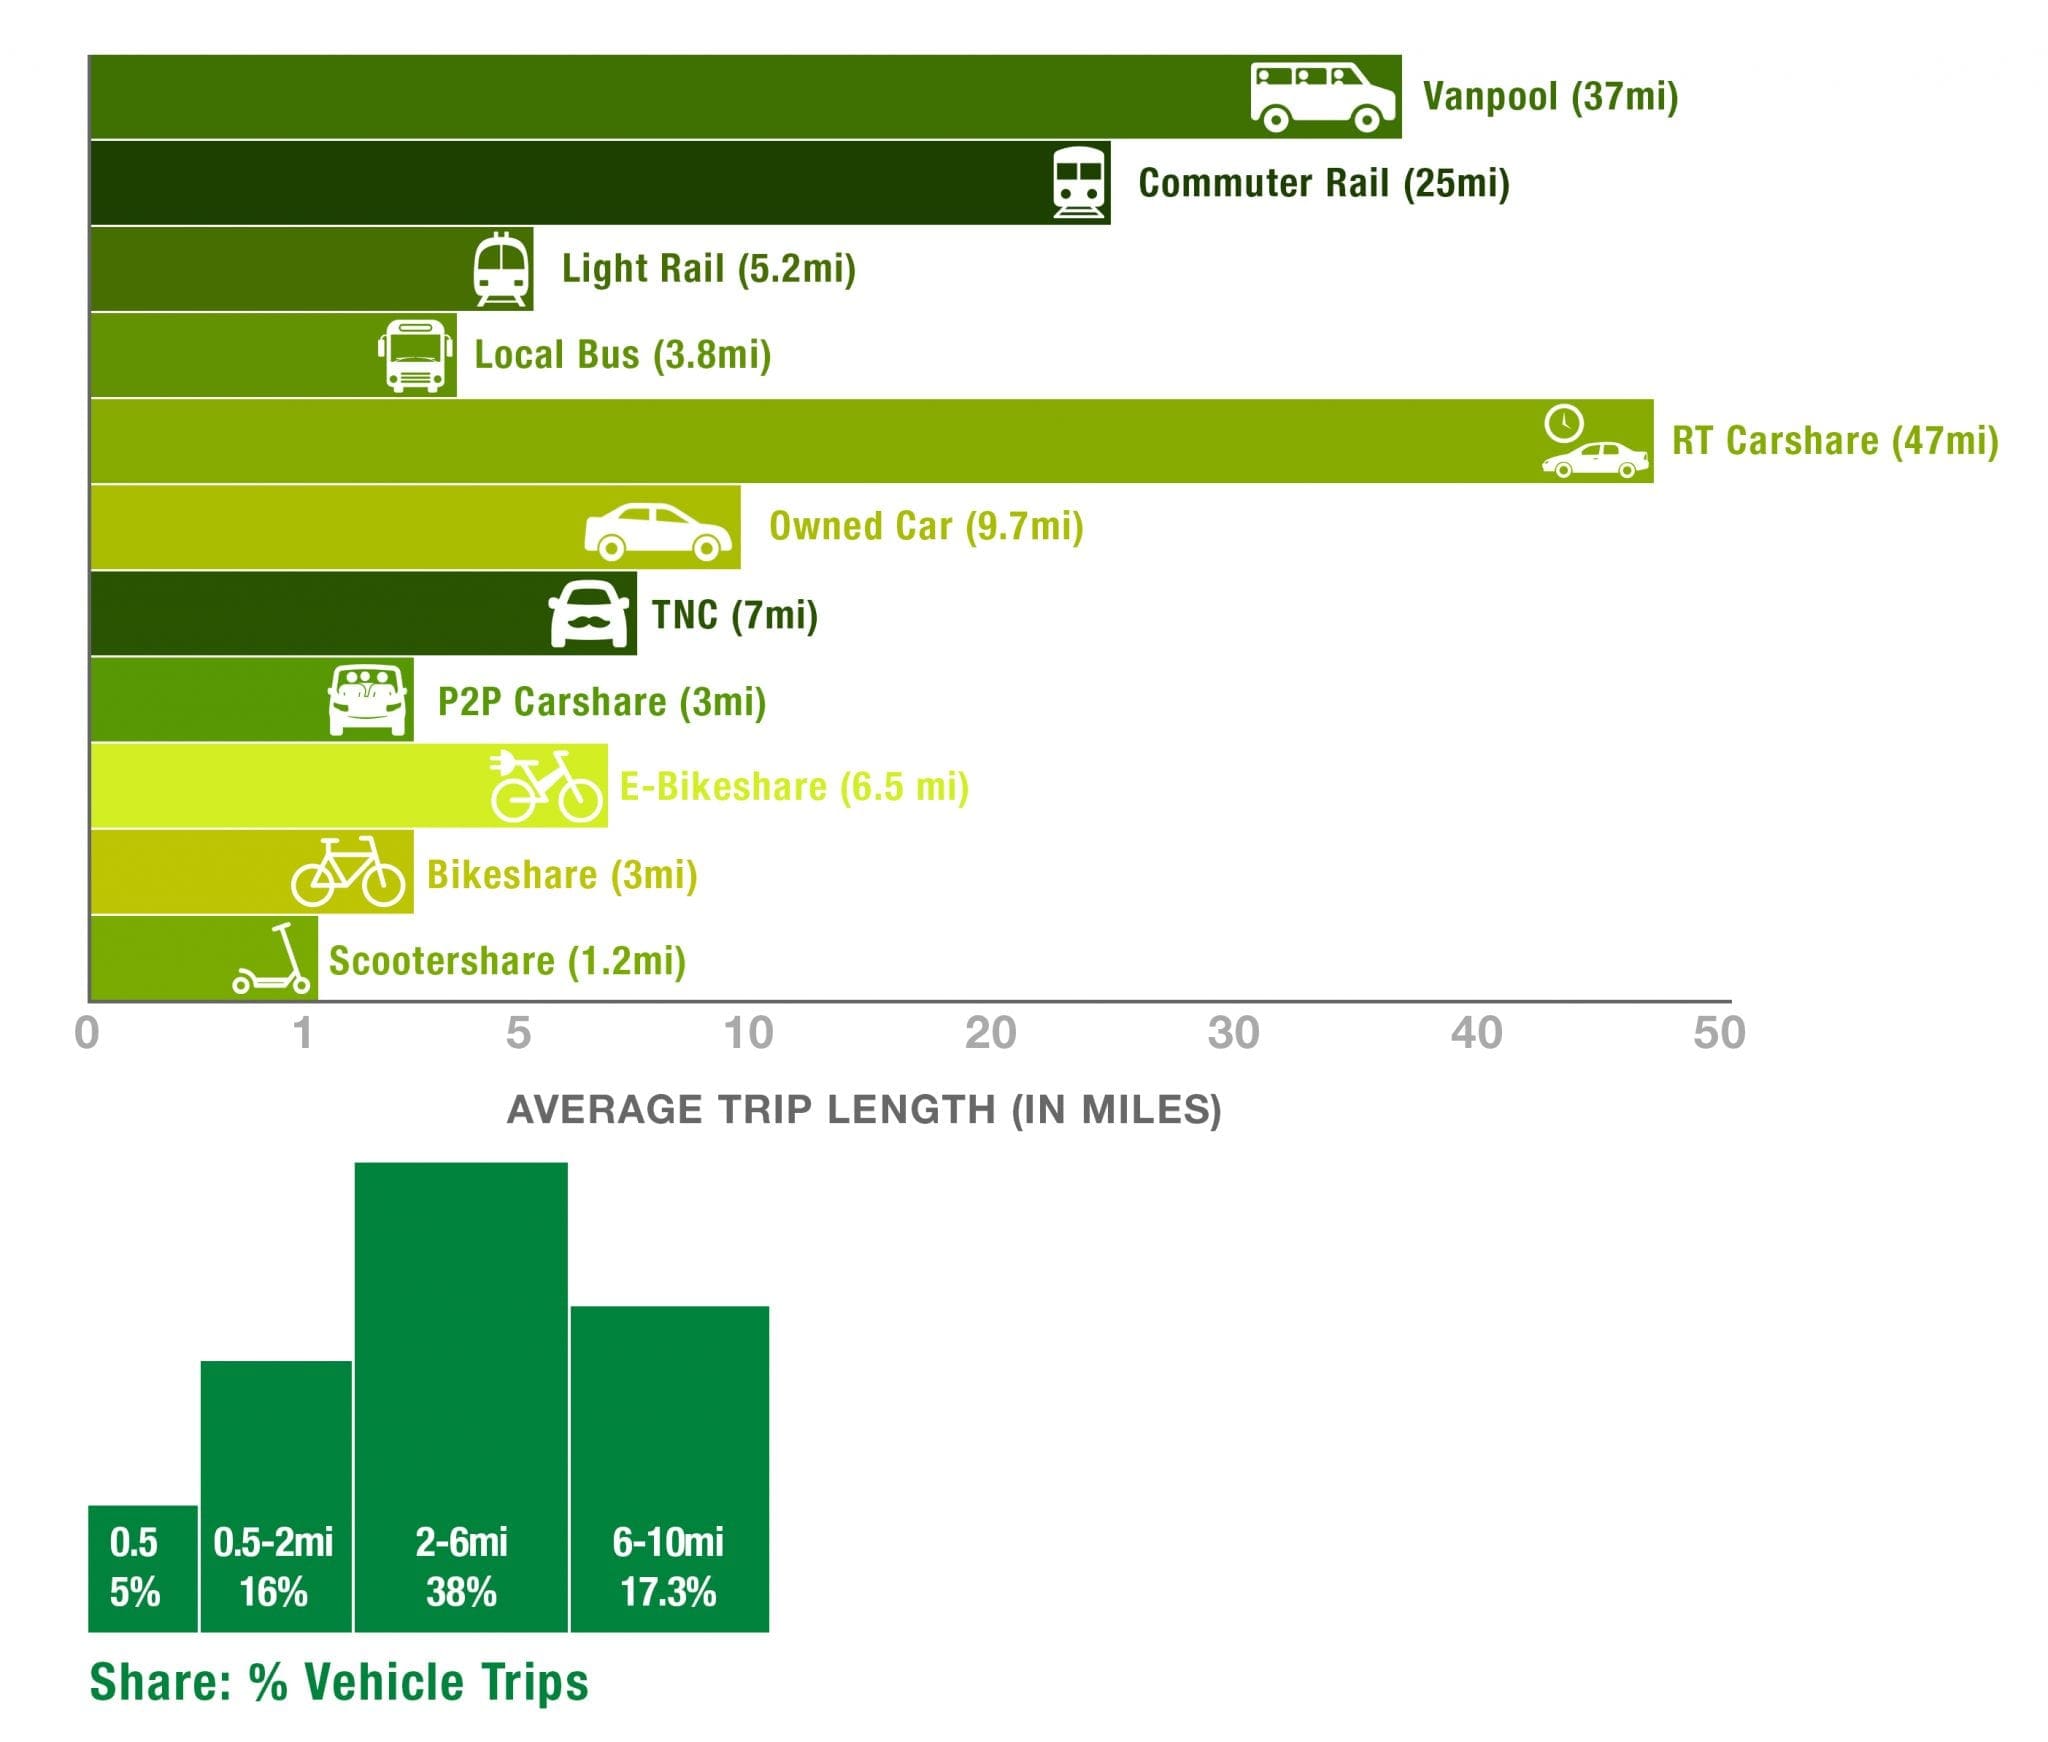
This raises an important question: how can cities and mobility companies fill these gaps while building sustainable micromobility systems? In Part 2, we’ll examine research, additional pilot project results, and trends for clues on building an integrated mobility system. Please get in touch and let us know your insights and questions on micromobility.